
Impact Capital’s quarterly research report seeks to highlight the latest developments most relevant to your investments and financial planning. In the latest installment of Impact Capital’s Three Market Themes quarterly research report, we focus on the importance of portfolio diversification, the market performance of Gold, and the general health of the market as measured by the advance-decline line.
1. Why We Diversify
The table below shows the annual returns for all the major asset classes: U.S. stocks, International stocks, Emerging Market stocks, Real Estate, Commodities, Bonds, and Gold. Each year, the asset classes are ranked from best to worst performance, with the resulting table looking like a quilt made up of patches of all different colors stitched together. There is no rhyme or reason that can help predict which asset class will be on top next year.
Keep in mind that we don’t have to predict the future to be successful investors, since diversification means owning a little bit of everything. The goal of diversification is to combine asset classes in a way so that, if keeping with the quilt analogy, when one patch of the portfolio is down, another patch of the portfolio is up.
The performance of a diversified portfolio is shown in the white boxes of the chart. If you look closely, you’ll notice the white boxes tend to remain in the middle most years. Throughout the entire timeframe from 2016 to 2025, the diversified portfolio earned 7.44% per year, which demonstrates that owning a diversified portfolio is a prudent approach to long-term investing.

2. Rocks over Stocks
If you look closely at the table above, you will see Gold (IAU) was the top performing asset class in 2025. We last wrote about gold in April 2024 (you can read it here under the section All That Glitters (In This Case) is Gold). The trend we identified back then has continued to this day, with central banks having chosen to use Gold in place of U.S. Dollars for their reserves. Last year, gold’s share of central bank’s reserves jumped from 24% to 30% last year, and the U.S. Dollar share slipped from 43% to 40% during the same period. Central banks are diversifying their holdings as countries around the world continue to print money to support their borrowing.
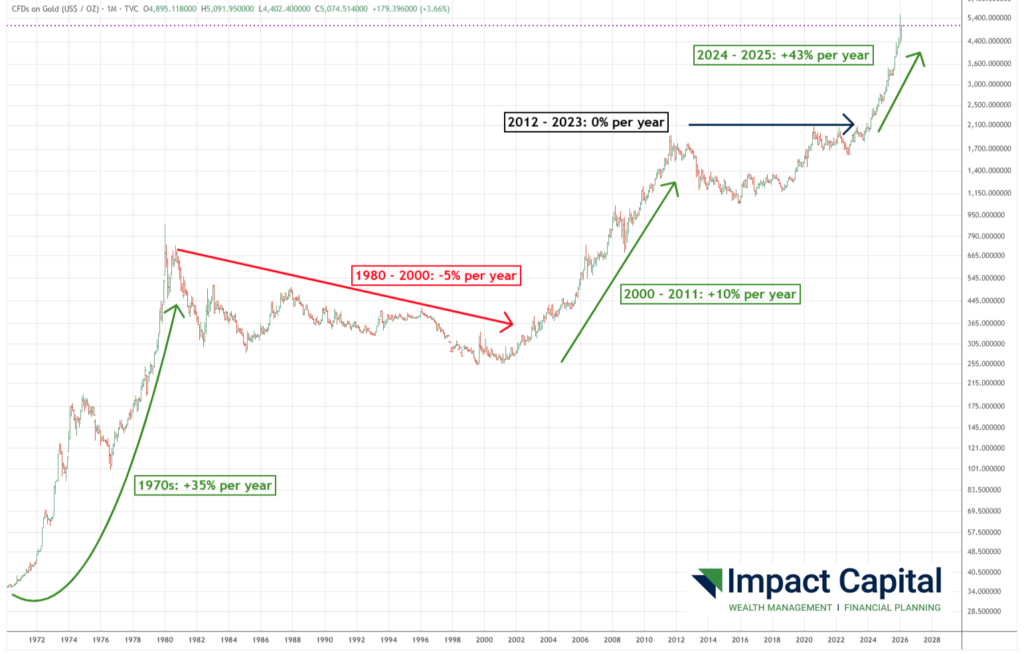
Gold could continue to appreciate in the future, although it can be difficult to make the case that gold should be held for the long-term (namely, 10-20 years). Gold doesn’t have earnings, interest payments, or dividends. There is no workforce showing up to work each day to be innovative or productive. A review of its past history in the chart below shows periods of growth followed by long periods of no growth. Can you imagine holding Gold for 20 years and losing 5% per year over the course of that period time? That type of volatility is probably not in line with your goals of compounding your wealth consistently over time.
3. The Trend: Man’s Best Friend
The stock market is an economic indicator. When investors become concerned about an economic recession, they sell stocks, pushing the overall level of the stock market lower. The opposite is also true; when investors are excited about economic growth in the future, they buy stocks, pushing the overall level of the stock market higher.
My favorite analogy is to compare the stock market and the economy to my dog, Ruby, and I out on a walk. For the purpose of this example, Ruby is the stock market and I am the economy. While Ruby is a sweet dog, she can get excited chasing rabbits, squirrels, and birds, so she is on a leash when we walk outside. While walking down the sidewalk, she will be darting from side to side sniffing whatever was there before. Ignoring her short-term (and excitable) distractions, we generally move in the same direction, though it does help that she only weighs 12 pounds.
The stock market is similar to Ruby, since it is often distracted from the course by bright-and-shiny short-term news updates, but in the long-term, it will follow the same path as the economy. When the stock market is near all-time highs, the market is saying the risk of recession is low. Furthermore, more and more stocks are rising, not falling.
The New York Stock Exchange Advance-Decline Line – an indicator which tracks a cumulative running total of advancing stocks minus declining stocks on the New York Stock Exchange – recently hit new all-time highs.
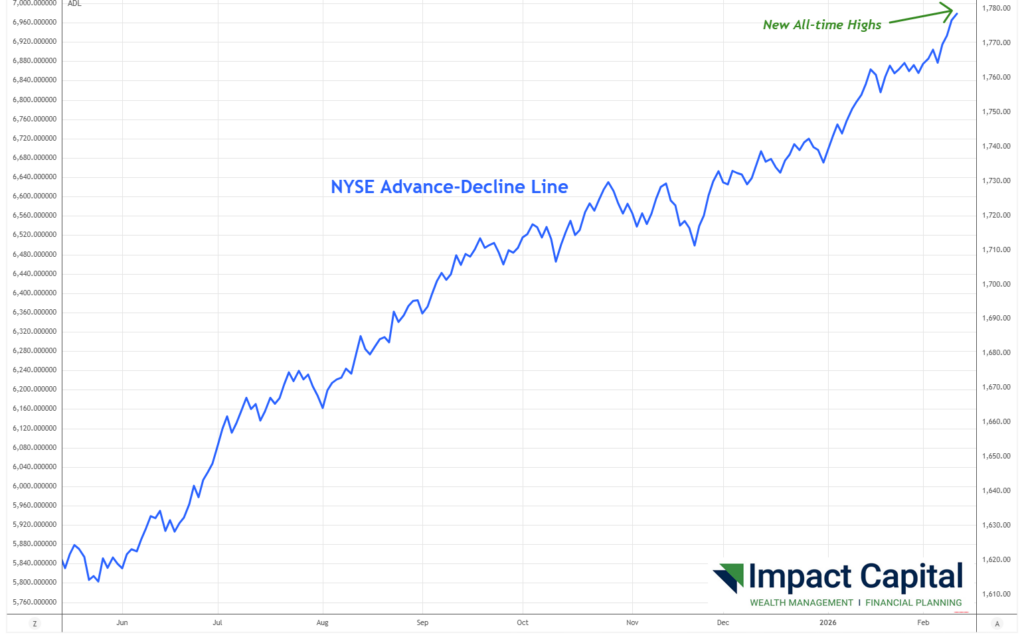
The advance-decline line can serve as an early warning system for future stock market weakness if it peaks before stock prices, but thankfully, that isn’t happening right now. As long as stock prices and the advance-decline line are moving up and to the right on our screens, we gauge the risk of recession to be fairly low right now. As for Ruby, she is living her best life right now too.

STAY IN THE LOOP