As many of you will immediately recognize, this blog post title was inspired by the Fleetwood Mac song, “Dreams”. Recently, the song returned to prominence when the song was part of a viral video in which a man is seen skateboarding down a hill while drinking cranberry juice with the song is playing. The video captures a very relaxed and carefree vibe which provides quite the juxtaposition to the stress-ridden year we’re experiencing. See it here.
Then see the copycat versions done by Mick Fleetwood himself here, a Pumpkin Man here, and soldiers and a dog in a helicopter here. Don’t ask how many times I’ve listened to the song in the last two weeks. Don’t ask about the back story about the song or the remix version of the song I found here. What can I say, when you are intellectually curious, you can end up going down some rabbit holes!
I’VE COME TO THINK OF THE CHORUS OF THE SONG AS A METAPHOR FOR THE STOCK MARKET.
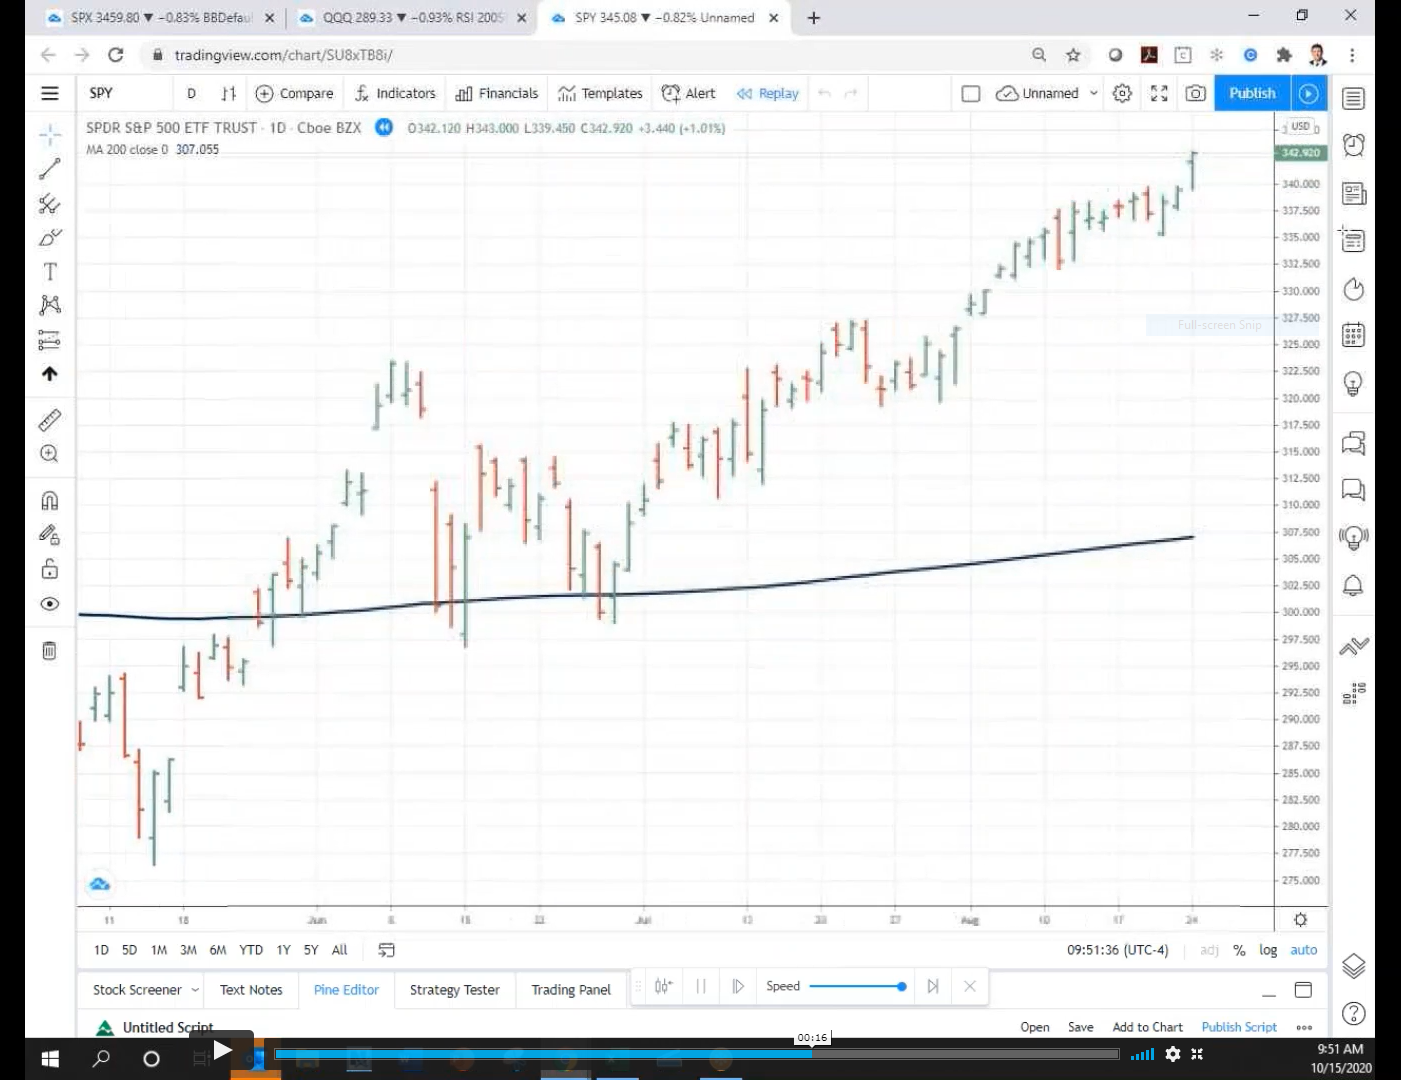
In the stock market, the worst days tend to happen after prices have already started falling. There’s a saying, “Nothing good happens beneath the 200 day moving average.” The 200 day moving average is simply the average of the last 200 day’s closing prices. It is a well-known reference point watched by market participants.
Since 1928, the average return of the S&P 500 has been 5.69% (not including dividends). During the 67% of the time the S&P 500 is above the 200 day moving average, the average return has been 9.87%. The return of the S&P 500 has been -2.38% during the 33% of the time it has been below the 200 day moving average.
THIS SOUNDS AMAZING! WHAT SHOULD I DO?
Before you start thinking the 200 day moving average is the holy grail of investing, realize these returns blissfully ignore the tax impact of constantly trading whenever the market goes above and below the average. While we don’t make trades based off the market’s relationship with the 200 day moving average specifically, we do believe in proactively managing risk. Right now, the market is above the 200 day moving average, which may surprise you considering COVID cases are rising worldwide and the uncertainty of the election results. My advice is to remain open minded about all possible outcomes, not just the negative ones. While you do that, enjoy my contribution to the #CranberryDreams videos. It shows the performance of the S&P 500 since the bottom in March, along with the 200 day moving average.
Stock Dreams from Impact Capital on Vimeo.
STAY IN THE LOOP
