
Impact Capital’s quarterly research report seeks to highlight the latest developments most relevant to your investments and financial planning. In the latest installment of Impact Capital’s Three Market Themes quarterly research report, we focus on speculation of an imminent recession, the Federal Reserve’s impact on the liquidity cycle, and the year-to-date performance of the S&P 500’s largest stocks.
1. The Next Recession is Coming
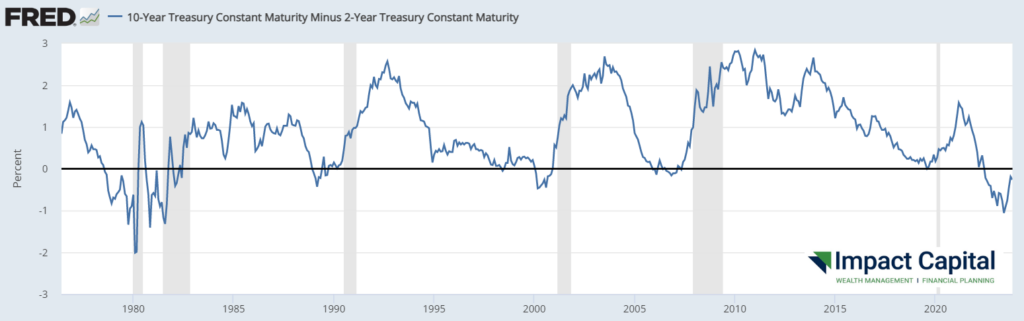
Over the last 40 years, a fascinating pattern emerged — each time the interest rate on the two-year Treasury note rose higher than the interest rate on the 10-year Treasury note, a recession followed within an average of 15 months. We previously discussed this trend in depth back in July of this year.
Previous recessions have generally followed a specific chain reaction of events. We list them sequentially below along with the corresponding dates for when they happened.
- The Yield Curve Inverts (July 2022)
- Stocks Top Out (January 2022 & July 2023)
- Our Risk Management Model Becomes Defensive (January 2022 & October 2023)
- The Yield Curve un-inverts (not yet, but heading in that direction)
- Unemployment starts rising (low was April 3.4%; now 3.9%)
The unemployment rate bottomed at 3.4% in April, and has since risen to 3.9% in October, a figure which was just reported on November 3. In addition, the federal government revised the August and September employment numbers downward. In fact, the government has revised every month’s numbers downward this entire year so far, and that hasn’t happened since… 2008.
2. The Liquidity Cycle
The business cycle is more often than not caused by the Federal Reserve. With good intentions, it is overly supportive in recessions and overly restrictive after recoveries. When faced with a pandemic, the Fed did all it could to support the economy — it brought interest rates to zero and bought bonds to stabilize the financial markets. At the time, this seemed like a prudent approach.
What no one realized during the lockdowns was that demand for goods and services was slowly (but surely) building. When the lockdowns ended, we were all geared up to spend the money we had saved, but companies were not ready to meet this spike in demand. This resulted in shortages and inflation. It turns out the economy didn’t need the Fed’s support after all — the only thing the Fed’s actions did was effectively throw a match on a gasoline-soaked economy.
The chart below depicts a typical business cycle, which is really driven by liquidity from the Fed (and other central banks around the world). This chart is meant to provide a framework with which to view the economy.
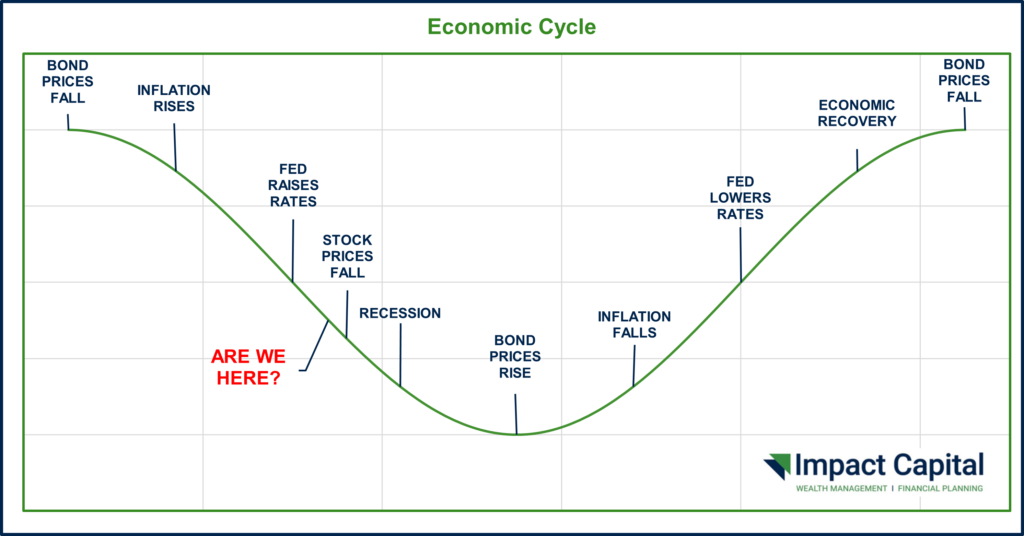
The line on the chart starts with bond prices falling (interest rates going up) due to inflation and in anticipation of the Fed raising interest rates. Bond prices actually peaked in March 2020, so once inflation arrived in 2021, the Fed knew it had to curb inflation by raising interest rates. Instead of buying bonds, it reduced the size of its balance sheet by selling bonds. Stocks started falling at the beginning of 2022 in anticipation of a possible recession, following the sequence of the Liquidity Cycle to a T.
According to the classic structure of the liquidity cycle, a recession will happen next. The recession part hasn’t happened – at least, not yet. Instead, the last 12 months have culminated in an awkward waiting period with conflicting economic reports. The Fed was still raising interest rates but has since stopped, and it is clear that the Fed is now dually concerned with making sure inflation is eradicated from the economy while at the same time trying not to stall the economy’s growth. Stocks and bonds have reflected this economically awkward liminal space by initially rising last October before stalling out over this past summer. Bond prices have risen in recent weeks, likely in anticipation that the Fed may be done raising interest rates and inflation has been banished. Time will tell in which stage of the liquidity cycle we fall.
3. Fund Managers Struggle to Beat the Market
In 2023, the largest stocks have done the best. The chart below shows the year-to-date performance of the S&P 500’s largest 50 stocks (+27%) and largest 100 stocks (+21%) outpacing the return of the S&P 500 index (+14%).
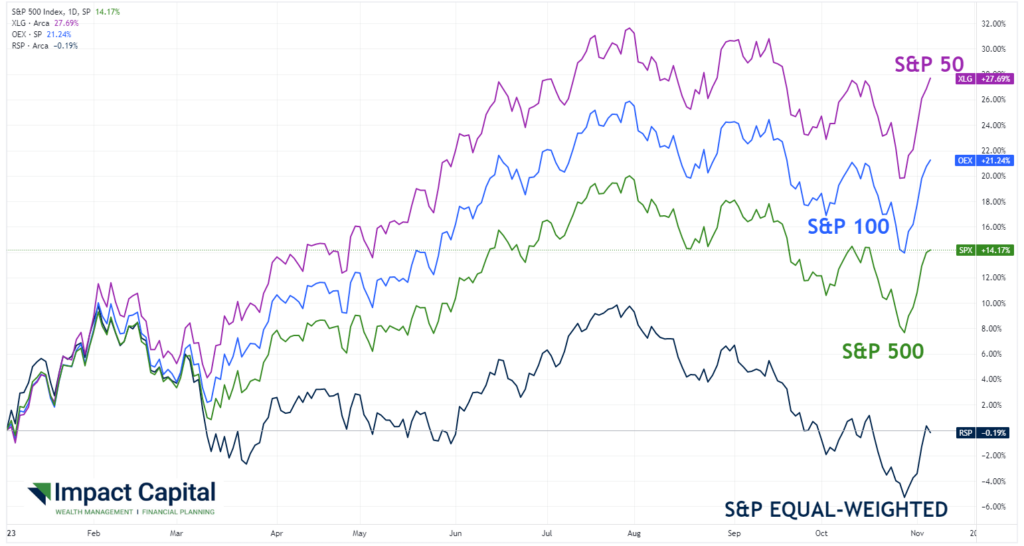
The S&P 500 index is market-capitalization-weighted, meaning the largest stocks have the most influence on the index performance. The largest four stocks comprise almost 20% of the index (AAPL 7%, MSFT 7%, AMZN 3%, NVDA 3%). To see what type of effect this has on performance, there is also an equal-weighted version of the index. The year-to-date performance of this version of the index is close to where it started the year (-0.19%). The equal-weighted version is more representative of the performance the typical stock has had this year. If your stock portfolio is underperforming the market, that would likely be because you don’t have 20% of your portfolio in AAPL/MSFT/AMZN/NVDA. We recommend that someone should never have more than 10% of their portfolio in any one stock, as the possible downside risk in one stock is much larger than the downside risk in 500 stocks.
STAY IN THE LOOP