Impact Capital’s quarterly research report seeks to highlight the latest developments most relevant to your investments and financial planning. In this installment of Three Market Themes, we will focus on market gains within the technology sector, how the performance of the S&P 500 measures up against the equally weighted version, and the underperformance of managed mutual funds.
1. Technology is the Only Leading Sector
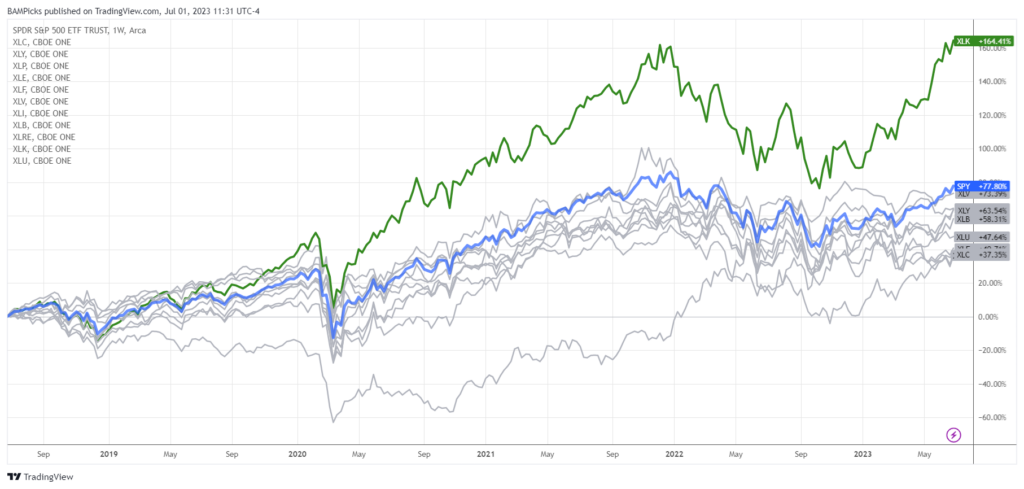
The chart below shows the performance of the S&P 500 – and the 11 sectors that it comprises – over the last five years as of June 30, 2023. The technology sector (shown in green) is the only sector to outperform the S&P 500 (shown in blue), and this year has been no different. The technology sector is up 41%, the most of any sector this year, with the two largest holdings in the technology sector of the S&P 500 being Apple, Inc. (AAPL) and Microsoft Corporation (MSFT). Each of these companies make up 23% of the technology index and are also the two largest companies in the S&P 500 as a whole, with each of them making up approximately 7% of the S&P 500 index.
The gains have been so concentrated among the largest tech companies that Nasdaq announced the Nasdaq 100 Index (ticker: QQQ) will undergo a Special Rebalance effective July 24. They are doing this to “address overconcentration in the index by redistributing the weights.” This will be the first time to date this type of rebalance has been done, as the index is typically reconstituted annually in December.

2. Bigger is Better
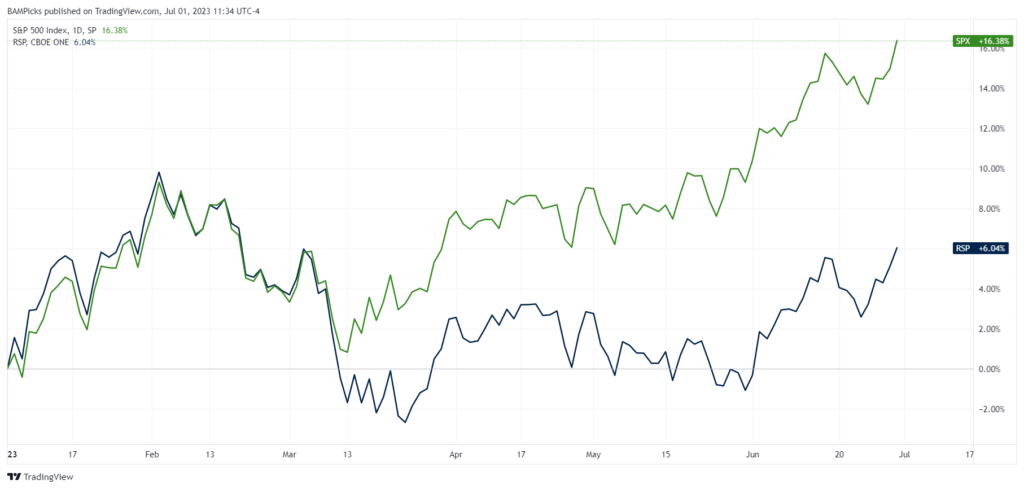
The S&P 500 is a market capitalization weighted index, which is a fancy way of saying the largest companies have the largest weighting in the index. One way to see the effect the largest companies have on the index is to compare the performance of the index to a version of the index that weighs all companies evenly. The chart below compares the recorded performance of the S&P 500 (SPY) to the equally weighted version of the index (RSP). This year through June 30, the S&P 500 is up by 15%, but RSP is only up by 6%. RSP peaked in early February and has fallen below that level ever since, even as the S&P 500 has raced higher. That being said, RSP is more accurately representative of how the average stock is performing this year. Outperforming the S&P 500 means having to outperform the largest companies in the S&P 500.

3. Fund Managers Struggle to Beat the Market
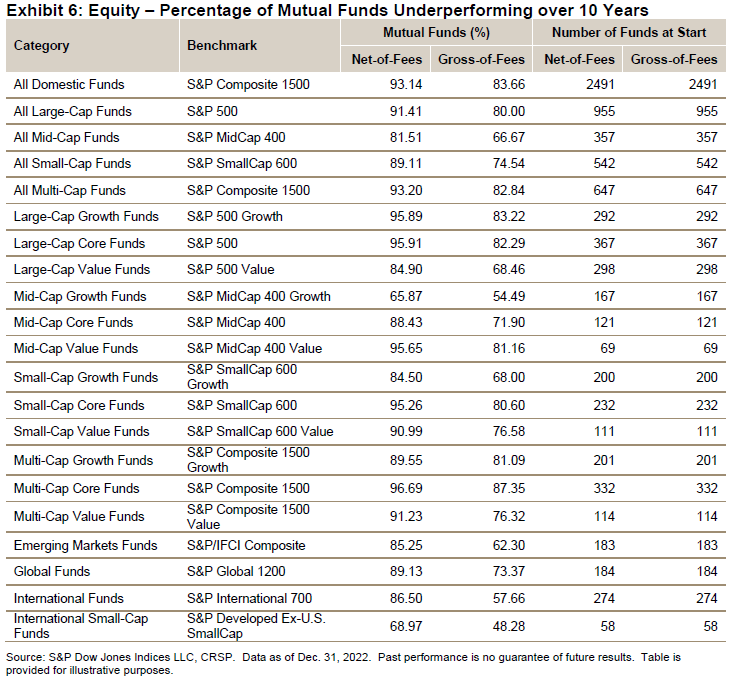
The statistics are clear: Almost all actively managed mutual funds underperformed the market in the last decade. According to S&P Dow Jones Indices1, 91% of all actively managed Large-Cap funds underperformed the S&P 500 over the last ten years ended December 31, 2022. The table below shows the percentage of mutual funds underperforming their respective benchmarks during this timeframe.

91%. That number is what pops into my head every time I see a financial or wealth management services commercial. Despite the data, the end goal for most people in the financial advice industry is to sell you a product “designed to beat the market.” They are paid to get you invest in their funds, regardless of how those funds perform.
Even some well-intended fiduciaries recommend actively managed mutual funds to their clients. While they are not paid by the funds, they believe trying to beat the market is part of their value proposition. The chances someone could identify those 9% in advance are even slimmer than 9%, but intentions aside, the results are nevertheless the same.
These results don’t even take into consideration the tax impact from holding an actively managed mutual fund. In general, actively managed funds are less tax-efficient than a mutual fund designed to match the market.
For all of these reasons, Impact Capital does not incorporate any actively managed mutual funds in our clients’ financial planning strategies.
1The SPIVA (S&P Indices versus Active) Scorecard is a research piece conducted and published by S&P Dow Jones Indices that compares actively managed funds against their appropriate benchmarks.
STAY IN THE LOOP
