
Impact Capital’s quarterly research report seeks to highlight the latest developments most relevant to your investments and financial planning. In the latest installment of Impact Capital’s Three Market Themes quarterly research report, we focus on the importance of diversification, the intermarket correlation between stocks and bonds, and the contrast in performance of the markets while under the control of each major political party.
1. Why We Diversify Investment Portfolios
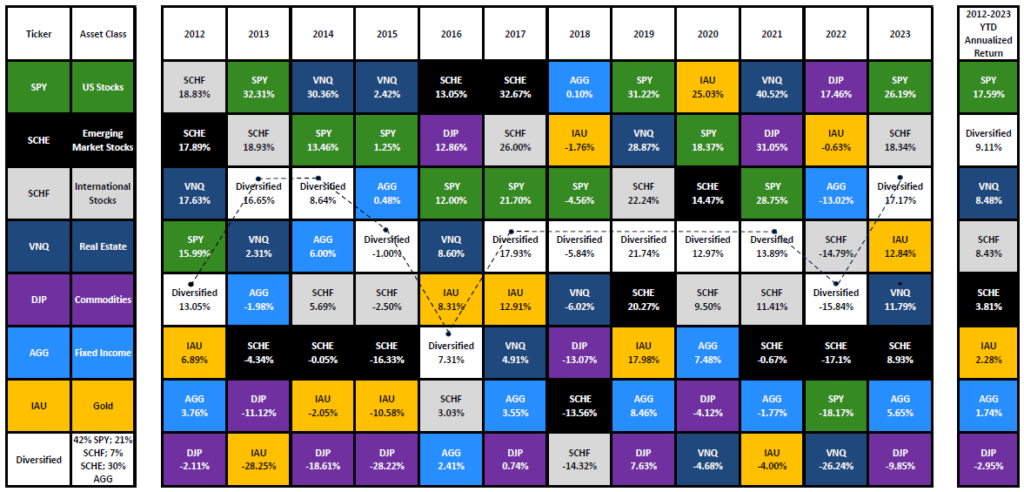
The table below shows the annual returns for all the major asset classes: U.S. stocks, International stocks, Emerging Market stocks, Real Estate, Commodities, Bonds, and Gold. Each year, the asset classes are ranked from best to worst performance, with the resulting table looking like a quilt made of all different colors. There is no rhyme or reason that can help predict which asset class will be on top next year.
Keep in mind that we don’t have to predict the future to be successful investors, since diversification means owning a little bit of everything. The goal of diversification is to combine asset classes in a way so that when one part of the portfolio is down, another part of the portfolio is up.
The performance of a simple diversified portfolio is shown in the white boxes of the chart. You’ll notice the white boxes tend to remain in the middle in most years, yet over the entire timeframe from 2010 to 2023, finishing second only to the S&P 500. Owning a diversified portfolio is therefore a prudent approach to long-term investing.
There has been an interesting pattern observed in the last three years where the best performing asset class from the previous year becomes the worst performing asset class the following year. For example, gold was the best performing asset class in 2020, but it was the worst performing asset class in 2021. Similarly, Real Estate was the best performing asset class in 2021, but the worst performing asset class in 2022. In turn, Commodities was the best performing asset class in 2022, but the worst performing asset class in 2023. If the pattern holds (nothing says it has to), U.S. stocks would be the worst performer in 2024 since they were the best performing asset class in 2023.
2. Bonds Have Stocks on a Tight Leash
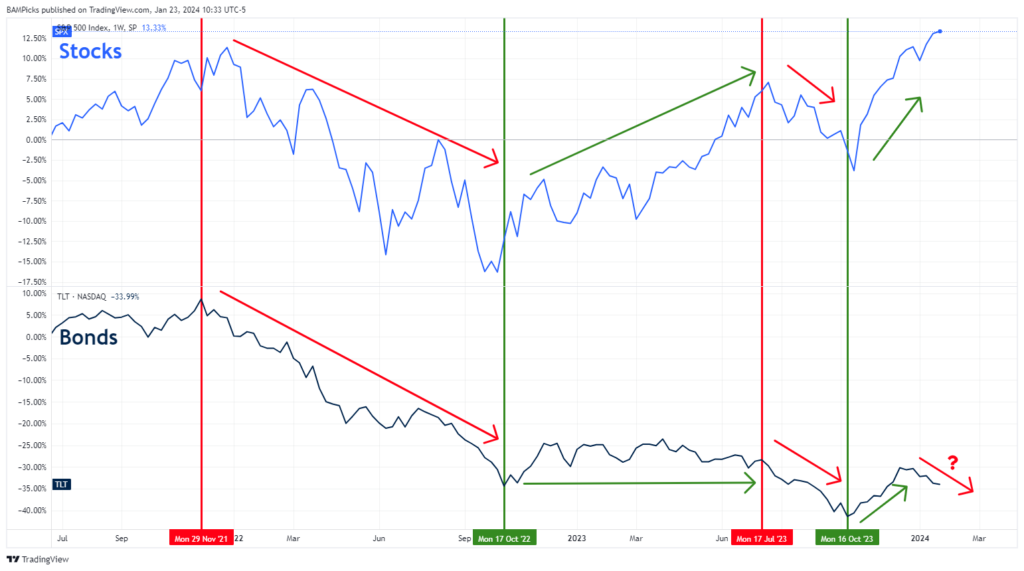
The fundamental thing to keep in mind is that all markets are connected — no market moves within a vacuum. For the last few years, changes in interest rates have had a major impact on the performance of the stock market. As we have illustrated in the chart below, bonds peaked in late 2021, with stocks peaking shortly thereafter. Both stocks and bonds fell as interest rates rose until October 2022. For the nine months that followed after, bonds stopped going down and stocks started going back up. The moment bonds started to fall between July and October 2023, stocks also fell, but they both recovered and started moving higher through the end of 2023.
This year, bonds have dropped lower, while stocks have continued rising higher. The narrative behind the stock market advance is that inflation was the result of a once-in-a-lifetime pandemic and is now behind us, and now that the Fed had defeated inflation, it would start cutting interest rates soon.
If this narrative were true, bond prices would be rising right now in anticipation of the Fed cutting rates, but that’s not what is happening. The Labor Department reported that consumer prices rose 3.1% in January from a year earlier. This data point is not consistent with the narrative of falling prices.
How did the markets react to the news? Both stocks and bonds fell. Before the inflation report was released, markets had predicted the first-rate cut would be in May. After the report’s release, markets adjusted their projections, predicting that the first-rate cut will be in June. When prices don’t confirm the popular narrative, it is best to call into question the accuracy of said narrative.
3. It’s an Election Year
One of the most dangerous narratives involves letting your politics dictate your investment decisions — please avoid doing this. Most people feel strongly the political party with which they are affiliated is best for the economy and the stock market. Their logic follows as such: If my party is best for the economy, then the other party must be bad for the economy. If my party wins, I want to invest aggressively, and if my party loses, I want to sell everything.
Trust us, if politics had any value in predicting the future of the stock market, then investing would be much easier. Unfortunately, the truth is politics are not predictive of future stock market performance.
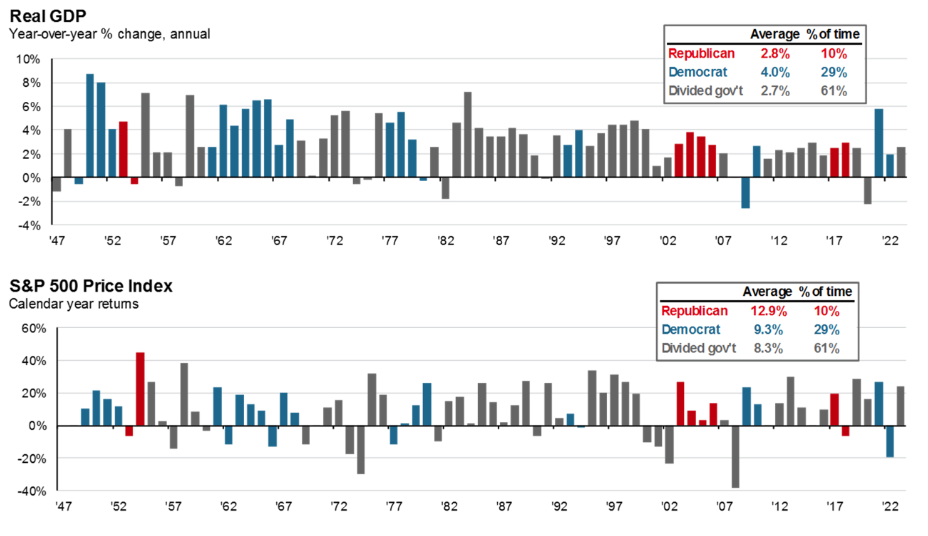
Refer to the charts below: The top chart below shows that the economy has grown faster when the Democratic party has control of the government. The bottom chart shows the U.S. stock market has performed better when the Republican party has control of the government. Most of the time, control of the government is split — you didn’t think I was going to take sides, did you?
One thing that is clear is the power of any politician, including the President of the United States, pales in comparison to the power the Federal Reserve holds over the economy.
STAY IN THE LOOP