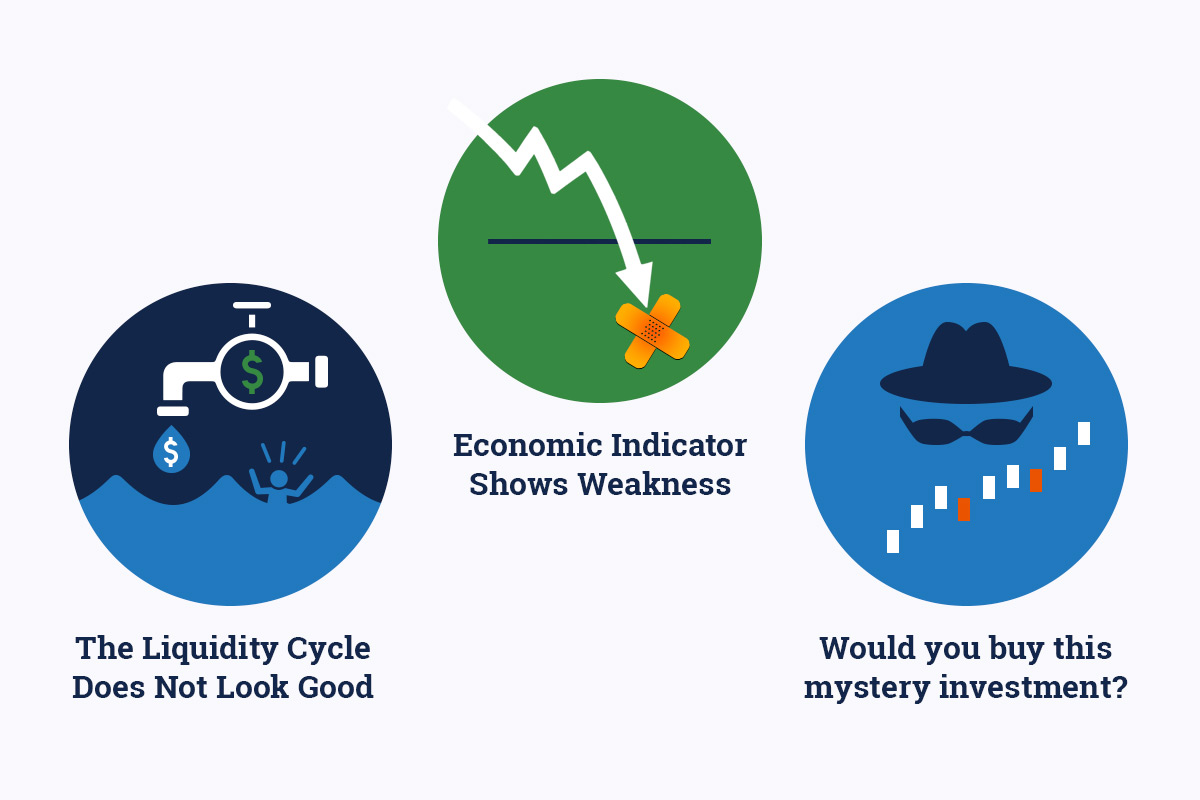
Impact Capital’s quarterly research report seeks to highlight the latest developments most relevant to your investments and financial planning. In this installment of Three Market Themes, we will focus on some key aspects of the business cycle.
1. The Liquidity Cycle Does Not Look Good

Despite their good intentions, the Federal Reserve’s actions often create a boom-and-bust economic cycle, also known as the liquidity cycle. We previously discussed this pattern in our March 2022 post.
When times are tough (i.e., the spread of the COVID-19 pandemic), the Federal Reserve keeps short-term interest rates low to incentivize borrowing in the hopes of growing the economy. When there is too much economic stimulus, inflation can appear. To rein in inflation, the Federal Reserve then raises short-term interest rates in the hopes of cooling the economy with a “soft landing,” meaning inflation is lowered without causing a recession.
Normally, long-term rates are higher than short-term rates. People lending over a longer period generally demand a higher rate of interest to compensate them for the increased opportunity cost of tying up their capital for a longer time frame. Longer duration loans also have more risk of higher rates.
Today, short-term rates — which are set by the Federal Reserve — are higher than long-term rates. Since 1980, this condition has historically predicted an incoming recession, implying that the Federal Reserve has raised rates too high and will have to cut them later. The timing, however, is not immediate in every case and it takes time for the economy to react to this condition.
2. Economic Indicator Shows Weakness

The top chart shows the U.S. ISM Purchasing Managers Index (PMI) data since 2003, which serves as a monthly indicator of U.S. economic activity based on a survey of purchasing managers at more than 300 manufacturing firms.
The bottom chart shows the 12-month rate of change in the S&P 500, an index that serves as a proxy for the stock market.
The last two ISM readings were recorded below 50, which indicates economic contraction. Excluding the COVID-19 pandemic, the last reported PMI was the lowest reading since February 2016. This data indicates the economy’s robust growth may be slowing.
3. Would You Buy this Mystery Investment?

While it is important to understand the current market environment, it is also crucial to maintain a historical perspective. The chart above shows the last 100 years of performance for the S&P 500, with each bar representing one year. A trajectory moving up and to the right is the sign of a good investment, even if it does have some red years every now and then. While last year was difficult, it is just a little blip on the screen in the context of history. Your investment horizon is longer than just one year.
Understand that you are not selling stock positions to pay for your dinner. We will do our best to buffer your losses in these trying times, but you will have time to recover.
Stick to the long-term plan. Historically speaking, the odds have been in your favor.
STAY IN THE LOOP
